CS 791 - A Critical Look at Network Protocols
Prof. John Byers
Lecture Notes
Scribe: Gabriel Nasser
9/30/1999
Overview
Today's lecture focuses on the discussion of the paper Why we don't
know how to simulate the Internet, by Paxson and Floyd. This
paper discusses the challenges that involve modelling and simulating of
the Internet as well as provides a survey of what has been done to improve
on this front and what considerations should be made for future research.
Before discussing the paper, we begin by overviewing some mathematical
notions: Heavy-tailed distributions and Poisson distributions.
Mathematics and such...
Poisson Distribution
We define the Poisson distribution as the function
P (k; L) = (L^k * e^(-L)) / k! , where
L is a constant and k varies.
L is the average rate of occurence of the events. This distribution
appears in many natural situations such as the number of telephone calls
per minute at some switchboard. This distribution has the property
that it is memoryless, that is to say there is no correlation between events.
Furthermore, we define the density function of such a distribution as follows
PDF: f (k; L) = L * e^(-Lk), (where L stands for
lambda)
And the cumulative distribution function is written as
CDF: F (x; L) = Pr[X <= x] = 1 - e^(-Lk)
(again, where L stands for lambda)
For such random variables as those obeying a Poisson distribution
the time interval between occurences of events is exponentially distributed.
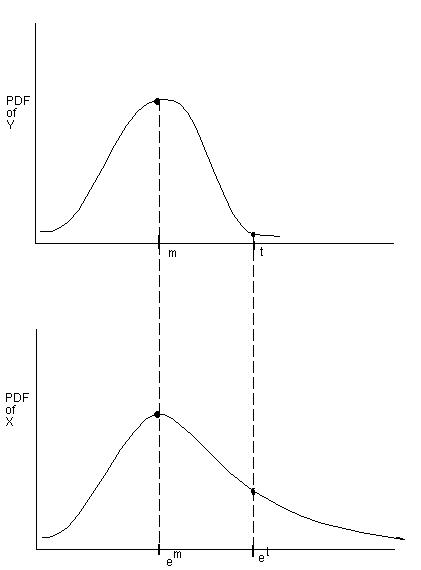
Log-normal Distribution (Heavy-tailed)
A random variable X is distributed log-normally if there is a random
variable Y, such that
Y =ln X
is ditributed normally. The following simple figure depicts the relation
between the random variables Y and X. Note the exponential spacing between
events.
A log-normal distribution has finite variance (as opposed to a Pareto
distribution).
A good rule-of-thumb to follow when testing for log-normality is to
plot the distribution on a log-scale, and verify that it looks normally
distributed.
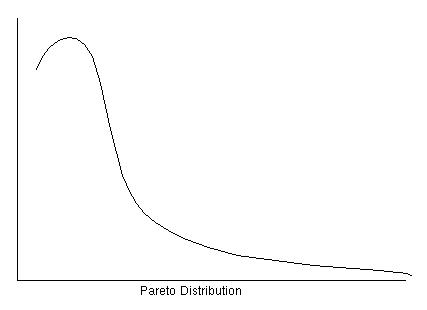
Pareto Distribution (Heavy-tailed)
A Pareto distribution is another example of a heavy-tailed distribution.
In particular, Pareto distribution stands out from the other distributions
in that it has infinite variance (see lecture slides). We write the
density function for such a distribution as follows
PDF: f (x; k, O) = (k * O^k) / x^(k+1)
The following figure depicts a Pareto distribution
The Internet Challenge
[PF97] V. Paxson and S. Floyd, Why We Don't Know How to Simulate the
Internet , In
Proceedings of the Winter Simulation Conference, December 1997.
The Internet is a huge, heterogeneous, unpredictable and irregularly
distributed system. These properties make it hard for anyone to try
to model and simulate it. The Internet is challenging on many fronts.
In particular we will take closer looks at its topology, or its physical
layout; the behavior of traffic over its links; and how it is has evolved
in the last years as well as outlooks for the future.
Topology
The topology of the Internet is not well-known to anyone. There exist
various maps of certain areas of the Internet, but nothing too significant.
Also, its structure is very irregular as there seems to be no pattern for
how it is laid out. This makes it very hard to speak of a representative
topology of the Internet: there is no such thing (yet). This aspect makes
it very hard for researchers to make sound assumptions about its topology
as they attempt to argue for a new technology. This make modelling
the Internet very hard. Moreover, even if we have a representative topology
of the Internet today, it may not be representative of tomorrow's Internet.
Also, a representative topology might sound ridiculous when considering
the size of the Internet: developing protocols in small representative
test environments is not a guarantee that these protocols will perform
or scale well as they are deployed in the Internet.
Traffic
Another difficult aspect is that of a representative traffic mix.
It is very hard to model Internet traffic due to its highly dynamic nature.
Several attempts are made to monitor traffic behavior using per packet
trace simulations which is not a good indicator of the nature of traffic.
Instead, the tendency is to use source-level (i.e. the application that
generates
the traffic) behavior monitoring when studying traffic trends, for a more
accurate result. Since traffic generation is tricky it makes it hard to
come up with at least a representative mix. Nevertheless, there are
certain invariants which make things a little easier...
A closer look at the distribution of user sessions reveals a nice Poisson
distribution, and thus are modeled as such. The only caveat is that
there are time of day effects, which makes the average rate of occurrence
of sessions during the day different from that at night, different than
that during the weekend, etc. When looking at the equations described
in the previous section, this is realized by changing the value of L.
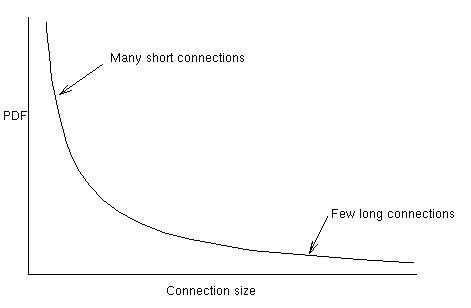
At a finer level of granularity, when we look at connections during
a single user session we observe that the connections follow a heavy-tailed
distribution. More precisely, we observe a small number of large connections,
but a large number of short-lived connections. The following graph
depicts the density function of the connction size
And, when observing the traffic at the gateway level, we observe a self-similar
process with long term correlation. The figure below gives a complete picture
of traffic and connection behavior at different levels.
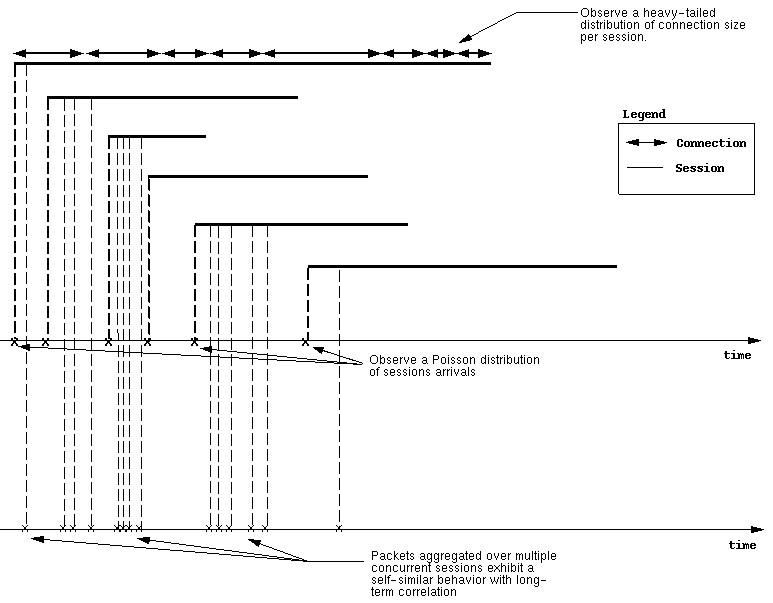
One thing to note about the above figure is that due to the Poisson
distribution of session arrivals there is no temporal correlation between
them.
Trends
One important issue to consider is how has the Internet been evolving over
recent years and whether the trend is likely to continue in the future.
This question remains unaswered as the Internet exhibits an unpridictable
behavior, specially with regards to how fast (or slow) it is growing.
The Internet is growing at an unpredictable pace, making it even more
difficult to obtain the slightest reasonable result or asssumption.
Even if we come up with representative "traffic mix" and topology today,
who or what is to guarantee that they will be representative tomorrow.
Consider the latest changes on the Internet:
-
Web caching is more and more popular
-
The slow move towards fair queuing policies
-
Deployment of multicast capabilities is ongoing but slow.
These changes are not major modifications. No real major change or
"revolution" has emerged lately on the Internet. Does the Internet seem
to have (finally) stabilized?
In summing, here are the major challenges that lie ahead along with
some proposed considerations
The Challenge...
|
...and the Considerations
|
| Realistic traffic mix... |
...perform a careful combination of per-packet trace simulation and
source-level behavior simulation as well as careful analysis. |
| Representative topology... |
...No such thing yet, though there
must exist certain patterns in the layout and structure of the Internet.
We need to exploit these patterns. |
| Future considerations... |
...Today's Internet is certainly not tomorrow's. We certainly need
to find scalable solutions. Moreover, account for "rare" events which are
no longer rare. Considerations also need to be made for potential revolutions,
such as "killer apps", etc. |
Conclusion
The key to success depends on building on existing work with a careful
combination of analysis and simulation so that the results are robust theoretically
and stand ground when put to the test. Emphasis is to feed existing
successful work (i.e. the VINT project) because it is the most efficient
and promising approach to handle the big challenge that is the Internet.