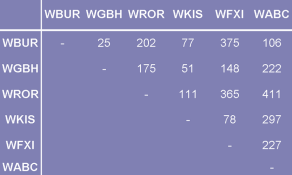
- [Graph Coloring] The Federal Communications Commission (FCC) prevents interference between radio stations by assigning appropriate frequencies to each station. Two stations cannot use the same channel when they are within 150 miles of each other. Use graph coloring to find out how many different frequencies are needed for the six stations located at the distances shown in the table below by following the steps below.
Model the conflict relationships between the above stations with a graph. What do the nodes of the graph represent? What does an edge in that graph represent?
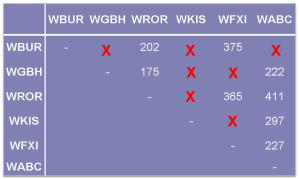
In the table below, an "X" marks stations that are within 150 miles of one another.
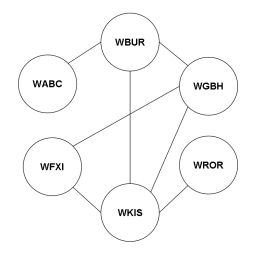
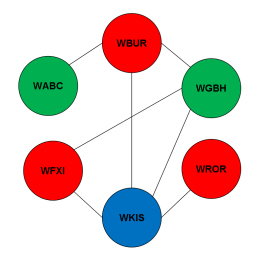
We can represent the conflict relationship between the stations as a graph: The nodes of the graph are the stations, and the edges represent interference between the station (i.e., distance between stations is less than 150 miles).
Identify the minimum number of colors needed to color the nodes of the graph you obtained in step (a) such that no two adjacent nodes are assigned the same color.
As shown below, three colors can be used to color the nodes such that no two nodes connected with an edge have the same color. Notice that one cannot do it with less colors [you can prove that by contradiction].
Use your answer in step (b) to determine the minimum number of frequencies needed for the six stations.
Minimum number of frequencies is also three (one corresponding to each color).
-
[Random Walks] You were hired by a marketing firm and were asked to review the rates that the firm is charging for three special displays at an amusement park. One of these displays is located at the main entrance of the park (location A); the second is located next to the food court (location B), and the third is located next to main ride (location C). Studies of how visitors of the park move from one location to another in a period of 15 minutes suggest that:
Of all people in location A: 20% end up going to location B, 50% end up going to location C, and 30% remain in location A.
Of all people in location B: 60% end up going to location C, and 40% end up going to location A.
Of all people in location C: 30% end up going to location A, and 30% end up going to location B, and 40% remain in location C.
Given this information, you proposed that a sensible approach to setting the pricing for the special displays is to make the price proportional to the number of people that are expected to be at each one of the three locations.
Show how you could model the flow of people as a graph. In particular, specify what constitutes the nodes of the graph, the edges of the graph, whether the edges are directed or not, and the labels on the edges.
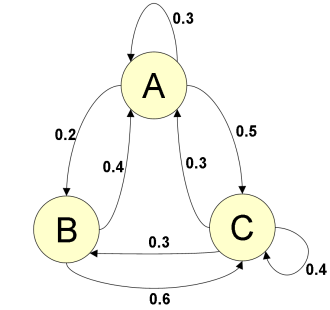
We can represent the park with a graph.
The nodes of the graph represent locations and the edges represent the flow of people between the various locations.
The edges are directed, and the labels on an edge going out of a node represent the percentage of the people flowing out of the location represented by the node along that edge.
Draw the graph corresponding to the above observations.
If P(A), P(B), and P(C) denote the proportion of the park visitors expected at each one of the three locations (long after the park opens in the morning). Write three relationships that would allow you to figure out these proportions.
We must always start with the following relationship saying that the sum of the proportion of the population in all locations must add up to 1 (100%).
P(A) + P(B) + P(C) = 1 --> eq #1
To solve for P(A), P(B), and P(C), we need two more relationships. For that, we pick any two of the following three relationships (which are derived from the above graph by looking at the flow into each node).
P(A) = 0.3*P(A) + 0.4*P(B) + 0.3*P(C) --> eq #2
P(B) = 0.2*P(A) + 0.3*P(C) --> eq #3
P(C) = 0.5*P(A) + 0.6*P(B) + 0.4*P(C)
Solve the set of equations you got in part c. to compute the values of P(A), P(B), and P(C).
By substituting for P(B) from eq #3 into eq #2, we get
P(A) = 0.3*P(A) + 0.08*P(A) + 0.12*P(C) + 0.3*P(C)
which we can reduce to
0.62*P(A) = 0.42*P(C)
which give us
P(A) = 0.677*P(C) --> eq #4
By substituting from eq #4 into eq #3, we get
P(B) = 0.435*P(C) --> eq #5
By substituting from eq #4 and eq #5 into eq #1, we get
0.677*P(C) + 0.435*P(C) + P(C) = 1
which give us
P(C) = 0.47
Using eq #3 and eq #4, we can solve for P(A), and P(B)
P(A) = 0.32
P(B) = 0.20
- [Queuing Delays] Cars arrive at a car wash at an average rate of 10 cars per hour and it takes 5 minutes on average to wash each car.
Answer the following questions:
- What is the capacity of the car wash operation? In other words, if there is a very long line of cars waiting to be washed, how many cars per unit time would it be possible to wash on average? Your answer here should be in terms of "cars per hour".
The maximum rate cars can go through the wash is
60(minutes per hour) / 5(minutes per car) = 12(cars per hour)
Thus, the capacity of the car wash service is 12 cars/hour
Note: since it takes 5 minutes to wash a car, if there is always a car ready to start as soon as one finishes then 12 can go through per hour.
- What is the utilization of the car wash? [Recall that the utilization (U) is defined as the ratio of the average rate of arrivals and the capacity].
The Utilization is the ratio between the request rate (actual rate of cars arriving at the car wash) and the capacity of the service (maximum rate for cars to go through the car wash). Thus U = 10/12 = 5/6 = 0.833
- What is the probability that there will be nobody at the car wash? What is the probability that there will be two cars at the car wash? [Recall that the probability of the size of the queue being i is given by (1-U)Ui where U is the queue utilization].
Probability[nobody at car wash] = Probability[queue size is 0] = (1-U)U0 = (1-U)*1 = 1 - 5/6 = 1/6 = 0.167
Probability[two cars at car wash] = Probability[queue size is 2] = (1-U)U2 = 0.116
- On average, how many cars do you expect to find at the car wash? [Recall that the average size of a queue is given by U/(1-U), where U is the queue utilization].
Note: You do not need to memorize the formula for calculating the probability of the queue being a specific size, or the formula for calculating the average length of a queue. While they are easy enough to remember, you would be given such formulas in an exam.