Old version
This is the CS 111 site as it appeared on May 10, 2018.
Lab 8: Nested loops; references; 2-D lists
Task 0: Tracing nested loops
-
Take out paper and a pencil.
-
Trace the following program using a table, and determine the output:
for i in [0, 1, 2]:
    for j in [3, 5]:
        k = i + j
        print(k)
print(i)
Here’s the beginning of the table:
ijkvalue printed 035... Remember that the inner loop executes in its entirety for each value of the outer loop.
-
Trace the following program using a table, and determine the output:
for i in [3, 2, 1]:
    for j in range(i):
        print(i * j)
print(j)
Here’s the beginning of the table:
irange(i)jvalue printed 3[0, 1, 2]0... Because the sequence used by the inner loop (
range(i)) depends on the value of the outer loop’s variable (i), we’ve included a column in the table for that sequence.
At the end of the lab, you should show your paper trace to the TF. To get credit for attendance at today’s lab, you must have made a good effort on this trace.
Task 1: Tracing code involving references
-
Consider the following Python program:
def foo(values, x):
    for i in range(len(values)):
        values[i] = i
    x += 1

a = [4, 5, 6]
b = a[:]
c = a
x = 5

foo(c, x)

print('a =', a)
print('b =', b)
print('c =', c)
print('x =', x)
Let’s trace through it together in Python Tutor.
Before the function call
foo(c, x)is made:-
How many distinct lists are there?
-
Which variables refer to the same list?
During the execution of the function:
-
What is the value of the parameter
values? -
What values does the variable
itake on? -
When the function call is about to complete, what return value does Python Tutor specify? Why does this make sense?
After the function call returns:
-
What output is produced?
-
Why have the values of some of the variables changed, while others have not?
-
-
What is the output of the following Python program? Draw a memory diagram to help illustrate your answer.
def foo(values):
    for i in range(len(values)):
        values[i] *= 2

def bar(values):
    for x in values:
        x *= 2

a = [1, 2, 3]
b = a
c = b[:]

foo(a)
bar(c)

print('a =', a)
print('b =', b)
print('c =', c)
At the end of the lab, you should show your memory diagram to the TF. To get credit for attendance at today’s lab, you must have made a good effort on this memory diagram.
Task 2: Understand and write functions for 2-D lists
In this task we’ll work with 2-D lists of single-digit integers between 0 and 9.
-
Begin by downloading the following file:
lab8task2.py. Open that file in IDLE, and put your work for this problem in that file. -
In
lab8task2.py, we have given you a function calledcreate_grid(height, width)that creates and returns a 2-D list ofheightrows andwidthcolumns in which all of the cells–i.e., all of the elements of the sublists–have a value of0.Try this function by running the file and entering the following from the Shell:
>>> grid = create_grid(3, 5)
>>> grid
[[0, 0, 0, 0, 0], [0, 0, 0, 0, 0], [0, 0, 0, 0, 0]]
-
As shown above, when Python prints a 2-D list, it “flattens” the list into one long list (wrapping it onto subsequent lines as needed).
To allow you to print your grids in 2-D–with one row per line–we’ve also provided a function called
print_grid(grid):>>> print_grid(grid) 0 0 0 0 0 0 0 0 0 0 0 0 0 0 0
-
We have also given you a function called
mod_grid(grid, n), which is supposed to take a 2-D list of integers (grid) and an integern, and to replace each value in the list with the modulus of that value withn.The current version of
mod_griddoesn’t work correctly. To see why, let’s copy the following program into Python Tutor and trace through it:def mod_grid(grid, n): height = len(grid) width = len(grid[0]) for r in range(height): for c in range(width): val = grid[r][c] val = val % n mygrid = [[5, 4, 3, 2], [3, 6, 9, 1], [4, 7, 2, 9]] mod_grid(mygrid, 2) print(mygrid)
-
As the nested loop executes, what happens to the values of
randc? -
Why isn’t the loop doing what it’s supposed to do? How could we fix it?
-
-
Go ahead and fix the version of
mod_gridthat’s found inlab8task2.py. Run the file in IDLE and test it:>>> mygrid = [[5, 4, 3, 2], [3, 6, 9, 1], [4, 7, 2, 9]] >>> print_grid(mygrid) 5 4 3 2 3 6 9 1 4 7 2 9 >>> mod_grid(mygrid, 2) >>> print_grid(mygrid) 1 0 1 0 1 0 1 1 0 1 0 1
-
Note that
mod_grid()doesn’t return a value. It doesn’t need to! That’s because its parametergridgets a copy of the reference to the original 2-D list, and thus any changes that it makes to the internals of that list will still be visible after the function returns.
Task 3: Work with images represented as 2-D lists
In this lab and in Problem Set 7, we’re
going to manipulate images that are represented as 2-D lists of pixels
– i.e., as 2-D lists of [R,G,B] triples.
-
Begin by downloading the following zip file: lab8image.zip
Unzip this archive, and you should find a folder named
lab8image, and within it several files, includinglab8task3.py. Open that file in IDLE, and put your work for this problem in that file. You should not move any of the files out of thelab8imagefolder. Keeping everything together will ensure that your functions are able to make use of the image-processing module that we’ve provided. -
At the top of
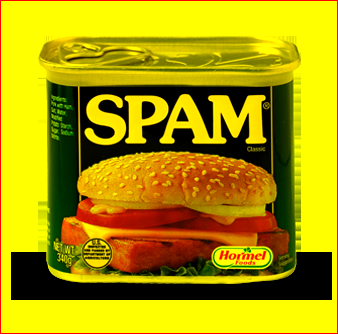
lab8task3.py, we’ve included animportstatement for thehmcpngmodule, which will allow you to convert a PNG image file to a 2-D lists of pixels, and vice versa.To see how this module works, run
lab8task3.pyin IDLE and enter the following command from the Shell:>>> pixels = load_pixels('spam.png')
After executing this statement, the variable
pixelsis a reference to a 2-D list in which:- each row corresponds to one row of pixels in the image
spam.png - each column corresponds to one column of pixels in the image
spam.png - each element
pixels[r][c]of the 2-D list is an [R,G,B] triple for the pixel at rowr, columncin the imagespam.png
For example:
>>> len(pixels)     # the number of rows (i.e., the height of the image)
344
>>> pixels[0][0]    # the pixel in the upper-left corner of the image is red
[255, 0, 0]
>>> pixels[10][20]  # the pixel at row 10, column 20 is white
[255, 255, 255]
- each row corresponds to one row of pixels in the image
-
To see a simple example of modifying an image, enter the following:
>>> for r in range(len(pixels)):
        pixels[r][r] = [0, 0, 255]    # make the pixels on the diagonal blue ([0, 0, 255])
>>> save_pixels(pixels, 'blue_diag_spam.png')
blue_diag_spam.png saved.
After executing these commands, your
lab8imagefolder should now include a file namedblue_diag_spam.png(although the.pngextension may or may not be visible). Double-clicking on that file should show you the following image:

-
In
lab8task3.py, we’ve given you a functioncreate_uniform_image(height, width, pixel)that creates and returns a 2-D list of pixels withheightrows andwidthcolumns in which all of the pixels have the RGB values given bypixel. Because all of the pixels will have the same color values, the resulting grid of pixels will produce an image with a uniform color – i.e., a solid block of that color.Try testing this function by entering the following from the Shell:
>>> pixels = create_uniform_image(100, 200, [255, 0, 0])  # all red
>>> save_pixels(pixels, 'red.png')
red.png saved.
Because
[255,0,0]represents the color red, you should obtain the following solid red image:

-
If you look closely at our
create_uniform_imagefunction, you’ll notice that we do not make a deep copy of the 1-D list represented bypixel. (To do so, we would have needed to compute a full slice ofpixel, or to take some comparable step.)Failing to perform a deep copy was a deliberate choice on our part, because it allows us to illustrate the impact of Python’s use of references in a dramatic way.
Enter the following commands to create and save a new image that is based on the pixels used to create
red.png:>>> pixels[0][0] # the pixel at [0][0] (row 0, column 0) [255, 0, 0] >>> pixels[0][0][1] # the green component of the pixel at [0][0] 0 >>> pixels[0][0][1] = 255 >>> save_pixels(pixels, 'mystery.png') mystery.png saved.
Before viewing this image, try to predict what it will look like...
Now go ahead and view it!
Pretty amazing, isn’t it? There are 20000 cells in the 2-D list
pixels, and this new image is the result of a single assignment to the green component ofpixels[0][0]! -
In
lab8task3.py, we’ve given you a function calledinvert()that inverts an image – changing the color of each pixel from its current color[r, g, b]to[255-r, 255-g, 255-b]. Review that function now to see how it works.A few things worth noting:
-
invert()takes a 2-D list of pixels. To use it, you need to load the image ahead of time usingload_pixels(), and then pass the resulting 2-D list of pixels toinvert(). For example:>>> pixels = load_pixels('spam.png') >>> inverted = invert(pixels) -
invertcreates and returns a new 2-D list of pixels for the inverted image. To actually see the image, you need to store the return value in a variable (as shown above), and then save the image usingsave_pixels():>>> save_pixels(inverted, 'inverted_spam.png')
-
-
Blue light is known to interfere with the body’s sleep cycle, so apps have been developed to reduce the amount of blue light that your phone or laptop emits in the evening. Write a function
remove_blue(pixels)that takes a 2-D listpixelscontaining pixels for an image, and that creates and returns a new 2-D list of pixels for an image in which the blue component of every pixel is set to 0.For example:
>>> pixels = load_pixels('spam.png')
>>> no_blue = remove_blue(pixels)
>>> save_pixels(no_blue, 'no_blue_spam.png')
If your function is working correctly, you should end up with the following result:
Task 4: Submit your work
You should turn in the paper with your memory diagram from Task 0 to the teaching fellow.
You should use Apollo to submit:
- your
lab8task2.pyfile - your
lab8task3.pyfile
Don’t worry if you didn’t finish all of the tasks. You should just submit whatever work you were able to complete during lab.
Here are the steps:
- Login to Apollo, using the link in the left-hand navigation bar. You will need to use your Kerberos user name and password.
- Check to see that your BU username is at the top of the Apollo page. If it isn’t, click the Log out button and login again.
- Find the appropriate lab section on the main page and click “Upload files.”
- For each file that you want to submit, find the matching upload section for the file. Make sure that you use the right section for each file. You may upload any number of files at a time.
- Click the “Upload” button at the bottom of the page.
- Review the upload results. If Apollo reports any issues, return to the upload page by clicking the link at the top of the results page, and try the upload again, per Apollo’s advice.
- Once all of your files have been successfully uploaded, return to the upload page by clicking the link at the top of the results page. The upload page will show you when you uploaded each file, and it will give you a way to view or download the uploaded file. Click on the link for each file so that you can ensure that you submitted the correct file.